Bioconductor build status:
- Devel: [](http://bioconductor.org/packages/devel/bioc/html/pRolocGUI.html)
- Release: [](http://bioconductor.org/packages/release/bioc/html/pRolocGUI.html)
Exploring and visualising spatial proteomics data
=================================================
<img align = "right" src="https://raw.githubusercontent.com/Bioconductor/BiocStickers/master/pRoloc/pRolocGUI.png" height="200">
## Introduction
The
[`pRolocGUI`](http://www.bioconductor.org/packages/devel/bioc/html/pRolocGUI.html)
package is an interactive interface to explore and visualise
experimental mass spectrometry-based spatial proteomics data. It
relies on the [`shiny`](http://shiny.rstudio.com/) framework for
interactive visualisation, the
[`MSnbase`](http://www.bioconductor.org/packages/release/bioc/html/MSnbase.html)
package to handle data and metadata and the
[`pRoloc`](http://www.bioconductor.org/packages/release/bioc/html/pRoloc.html)
software for spatial proteomics specific data matters. Example spatial
data is available in the
[`pRolocdata`](http://bioconductor.org/packages/release/data/experiment/html/pRolocdata.html)
experiment package.
The `pRoloc` suite set of software are distributed as part of the
`R`/[Bioconductor](http://bioconductor.org/) project and are developed
by Lisa Breckels at the [Cambridge Centre for Proteomics](http://proteomics.bio.cam.ac.uk)
at the University of Cambridge and by [Laurent Gatto](http://lgatto.github.io/),
director of the Computational Biology and Bioinformatics (CBIO) group
at UCLouvain, in Belgium.
This document describes the installation of the software, followed by
a basic quick start guide for using `pRolocGUI` to search and
visualise spatial proteomics data. Please refer to the respective
documentation and vignettes for full details about the software.
If you use these open-source software for your research, please cite:
> Gatto L, Breckels LM, Wieczorek S, Burger T, Lilley KS.
> Mass-spectrometry-based spatial proteomics data analysis using
> pRoloc and pRolocdata. Bioinformatics. 2014 May 1;30(9):1322-4.
> doi:10.1093/bioinformatics/btu013. Epub 2014 Jan 11. PMID:24413670;
> PMCID:PMC3998135.
> Breckels LM, Gatto L, Christoforou A, Groen AJ, Lilley KS, Trotter
> MW. The effect of organelle discovery upon sub-cellular protein
> localisation. J Proteomics. 2013 Mar 21. doi:pii:
> S1874-3919(13)00094-8. 10.1016/j.jprot.2013.02.019. PMID:23523639.
> Gatto L., Breckels L.M., Burger T, Nightingale D.J.H., Groen A.J.,
> Campbell C., Mulvey C.M., Christoforou A., Ferro M., Lilley K.S. 'A
> foundation for reliable spatial proteomics data analysis' Mol Cell
> Proteomics. 2014 May 20.
## Installation
`pRolocGUI` is written in the [`R`](http://www.r-project.org/)
programming language. Before installing the software you need to
download `R` and (optionally) `RStudio`.
1) Download the latest `R` release for your operating system from the
[R website](http://www.r-project.org/) and install it.
2) Optional, but
recommended. [Download](http://www.rstudio.com/products/rstudio/download/)
and install the RStudio IDE. `RStudio` provides a good code editor and
excellent integration with the `R` terminal.
3) Start `R` or `RStudio`.
4) Install the Bioconductor packages `pRoloc`, `pRolocdata` and
`pRolocGUI`:
`pRolocGUI` requires `R >= 3.1.1` and Bioconductor version `>= 3.0`.
In an `R` console, type
```
if (!requireNamespace("BiocManager", quietly=TRUE))
install.packages("BiocManager")
BiocManager::install(c("pRoloc", "pRolocdata", "pRolocGUI"))
```
#### Development version
The development code on github can also be installed using
`BiocManager::install` (or `install_github`). New pre-release features
might not be documented or thoroughly tested and could substantially
change prior to release. Use at your own risks.
```
BiocManager::install("ComputationalProteomicsUnit/pRolocGUI")
```
## Getting started
Before using a package's functionality, it needs to be loaded:
```
library("pRolocGUI")
```
We first load data from
[Christoforou et al 2016](http://www.nature.com/ncomms/2016/160112/ncomms9992/full/ncomms9992.html)
distributed in the `pRolocdata` package:
```
library("pRolocdata")
data(hyperLOPIT2015)
```
There are 3 different visualisation applications currently
available: `explore`, `compare` and `aggregate`.
These apps are launched using the `pRolocVis` function and
passing `object`, which is an `MSnSet` containing the data
one wishes to interrogate. One may also specify which app
they wish to use by using the `app` argument, see `?pRolocVis`
for more details. The default app that is loaded if
`app` is not specified is the `explore` application:
```
pRolocVis(hyperLOPIT2015)
```
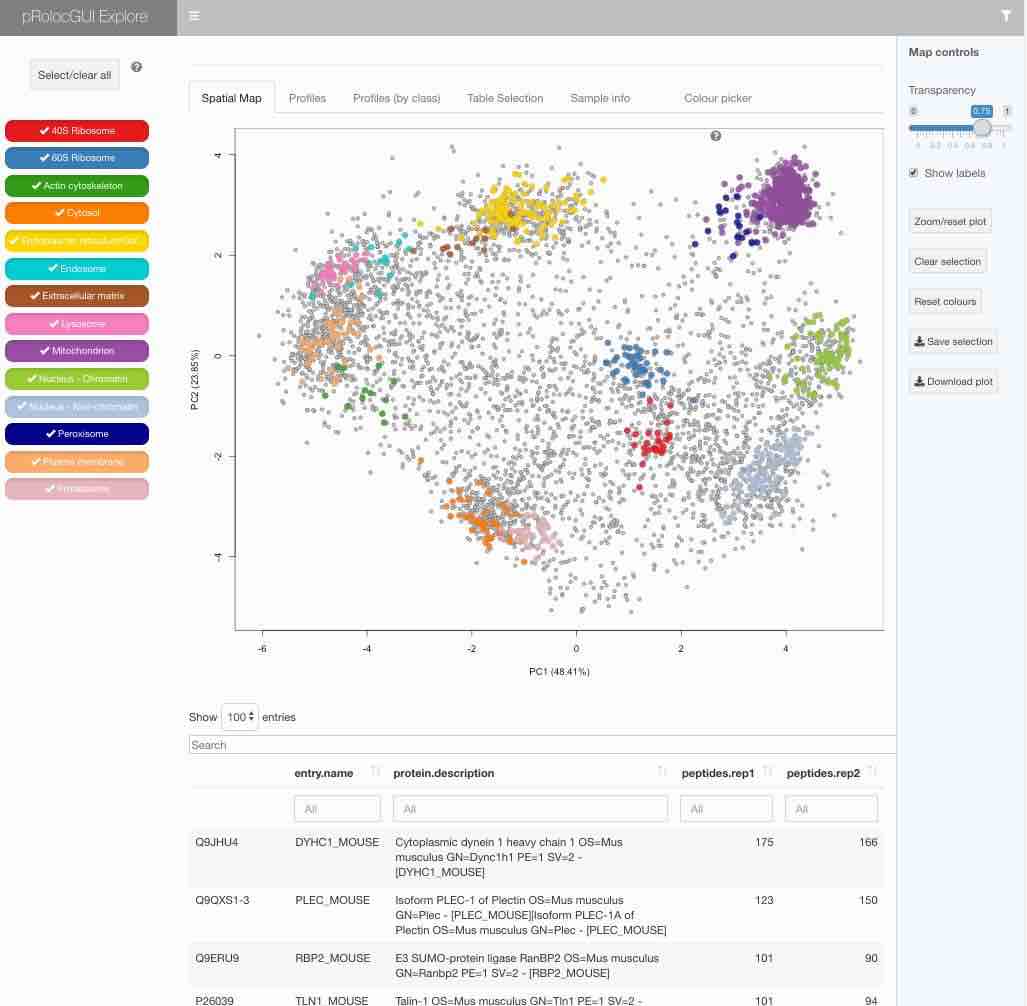
The graphical interface is described in details in the package
vignette that is included in the package itself (get it by typing
`vignette("pRolocGUI")` in `R`), available by clicking the `?` once
the interface is loaded or can be
[consulted online](http://bioconductor.org/packages/devel/bioc/vignettes/pRolocGUI/inst/doc/pRolocGUI.html).
## More resources
### Support
* The Bioconductor [support forum](https://support.bioconductor.org/)
* Open a `pRolocGUI` GitHub
[issue](https://github.com/ComputationalProteomicsUnit/pRolocGUI/issues)
(requires a free GitHub account).
### Videos (new videos will appear shortly for the new apps)
0. [An introduction to Bioconductor](https://www.youtube.com/watch?v=dg6NvmMVQ3I)
1. [A brief introduction to `pRolocGUI`](http://youtu.be/zXtiiAoB_vM)
2. [Downloading and install `R`](http://youtu.be/qHMUnZnrkdA)
3. [Using RStudio](http://youtu.be/vlSbKf0OK3g)
4. [Installing the `pRolocGUI` interface](http://youtu.be/_VmAZF1g_O4)
5. [Starting `pRolocGUI`](http://youtu.be/24gntTd133w) - This tutorial is for the older legacy applications. New videos will appear shortly for the new applications.
6. [Using `pRolocGUI` to explore and visualise experimental spatial proteomics data](http://youtu.be/cG3PEQ-uWhM) - This tutorial is for the older legacy applications. New videos will appear shortly for the new applications.
Tutorial [playlist](https://www.youtube.com/watch?v=qHMUnZnrkdA&list=PLvIXxpatSLA2loV5Srs2VBpJIYUlVJ4ow).
### General resources
- [Teaching material](http://lgatto.github.io/TeachingMaterial/)
- R and Bioconductor for proteomics
[web page](http://lgatto.github.io/RforProteomics/) and
[package](http://www.bioconductor.org/packages/release/data/experiment/html/RforProteomics.html).

