# Director
Director is an R package designed to streamline the visualization of multiple levels of interacting
biological data. It utilizes the R package htmltools and customized Sankey plugin of the JavaScript library D3 (http://d3js.org) to provide an
alternative to standard network visualization of biological networks. It is a fast
and easy browser-enabled solution to discovering potentially interesting downstream effects or regulatory
pathways. The diagrams are dynamic, interactive, and packaged as HTML
files, making them highly portable and eliminating the need for third-party software. This
enables a straightforward approach for scientists to interpret the data produced, and bioinformatics
developers an alternative means to present relevant data.
## How it works
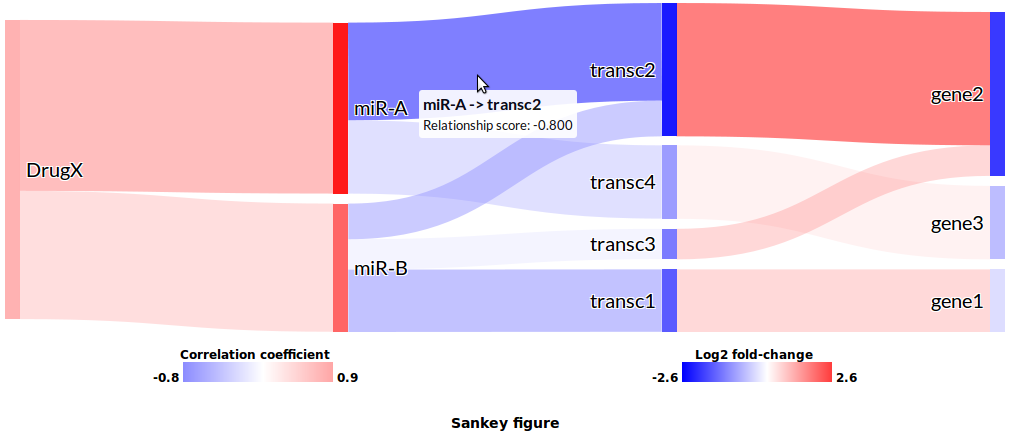
Two types of quantitive information are all that's needed to render the diagram: values for nodes and values for
paths. The package assumes nodes are molecules of interest and that the quantitative value is the
feature which makes them interesting, e.g. expression fold-change, significance value, or methylation score.
Similarly, paths represent a predictive or quantitative measure of the interaction
between molecules (e.g. correlation, affinity score).
Quantitative values are used to render the diagram. Molecules with strong quantitative values,
multiple and strong interactions are automatically emphasized in the diagram. A
connected series of such molecules would, in turn, identify potentially
interesting regulatory cascades -- visual information not as easily nor
intuitively conveyed with standard network approaches.
## Get it
Package installation instructions for R are found on [http://kzouchka.github.io/Director/](http://kzouchka.github.io/Director/)
## How to cite
Icay, K. and Liu, C. and Hautaniemi, S. (2018)
Dynamic visualization of multi-level molecular data: The Director package in R
Comput Methods Programs Biomed 153: 129--136
10.1016/j.cmpb.2017.10.013
[https://www.sciencedirect.com/science/article/pii/S0169260716306964]

